A steady increase in the circulating supply of stablecoins shows an increasing demand for these assets. It suggests that more traders and investors are preparing to enter the market or facilitating more trading activity.
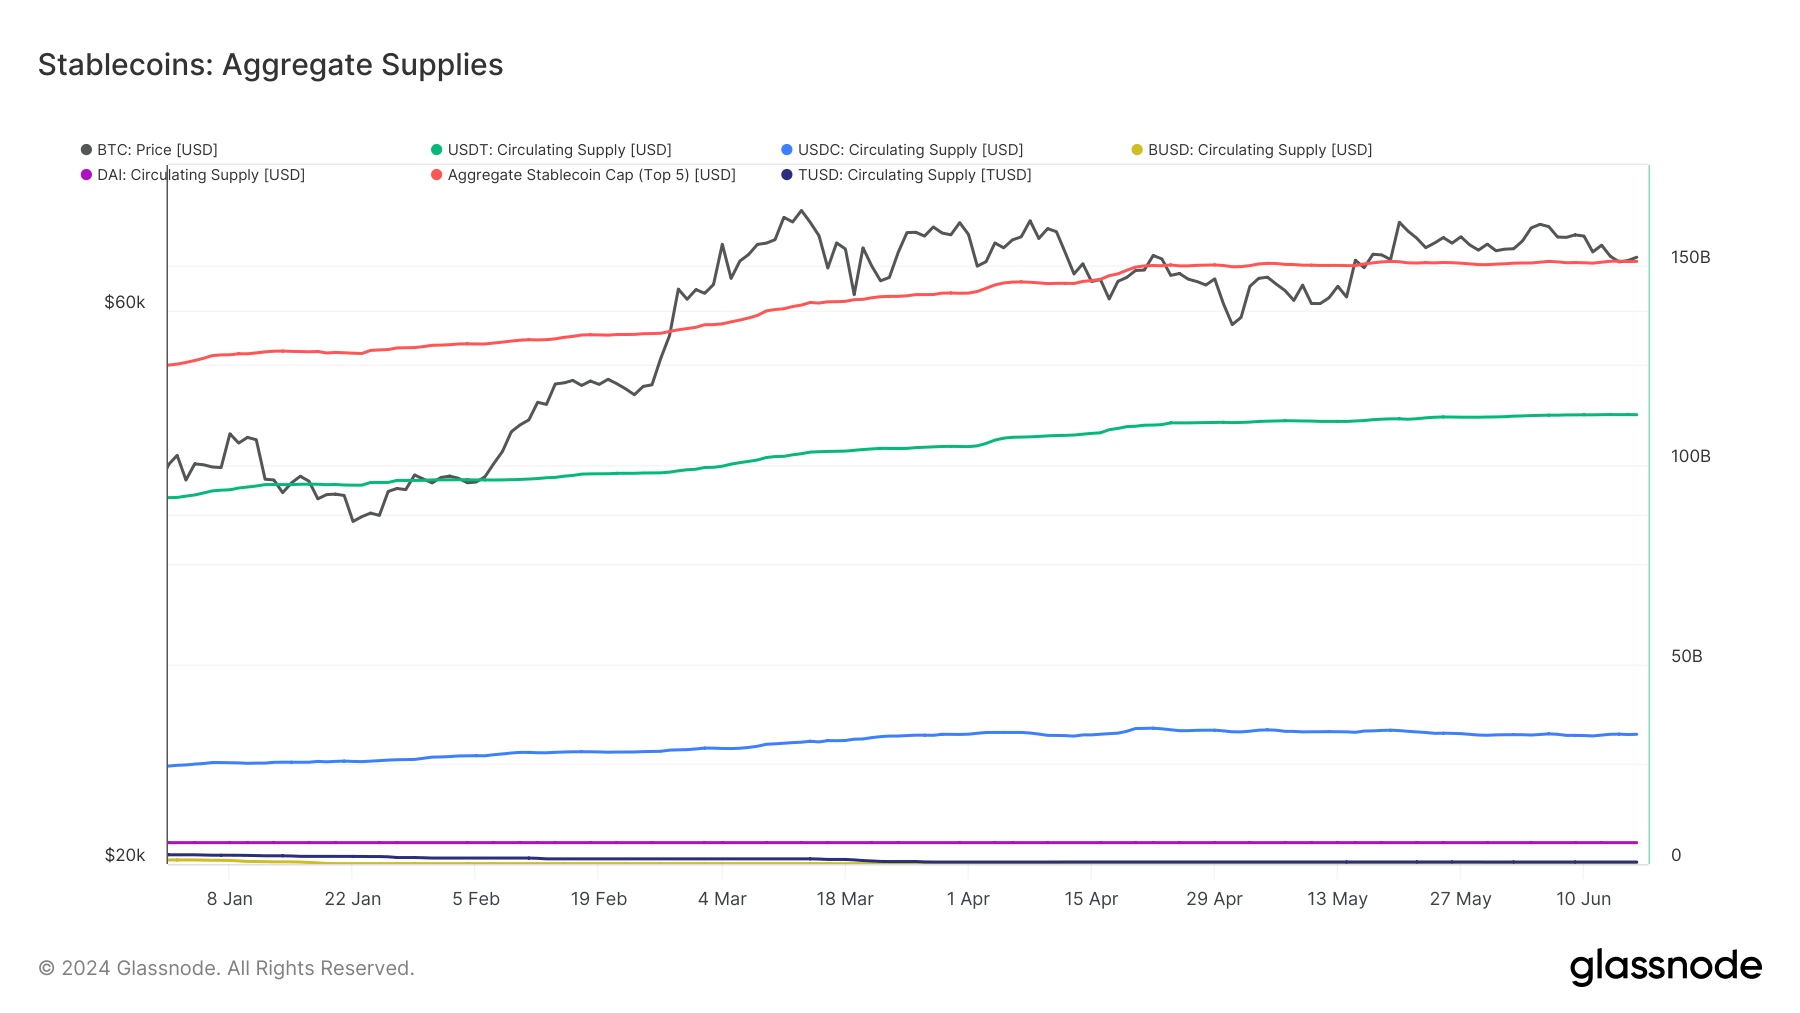
The increase in the aggregate circulating supply of stablecoins over the last six months represents a significant development. The aggregate supply of the five largest coins peaked at over $150.874 billion on June 16 — representing a substantial increase from the $124.890 billion recorded at the beginning of the year.
Stablecoins provide a haven during periods of market uncertainty and liquidity during periods of upward price movements. The increase in their circulating supply shows a shift towards stability and risk management among investors and an overall maturity in the market, which chooses to deploy its capital through stablecoins instead of fiat currencies.
The specific changes in the circulating supplies of individual stablecoins show how market preferences shifted throughout the year.
Tether remains a dominant force in the stablecoin market, with USDT supply rising from $91.71 billion to $112.48 billion. Similarly, USDC’s growth from $24.5 billion to $32.4 billion indicates strong demand for Circle’s stablecoin.
In contrast, the dramatic decrease in BUSD’s supply from $1.011 billion to $70.421 million and TUSD’s drop from $2.310 billion to $495.710 million reflects their significant regulatory challenges and decreasing investor interest.
The fact that DAI’s supply has remained constant at $5.347 billion suggests a stable demand for this decentralized stablecoin, which could reflect a preference for decentralized financial products in the market. The stability amid fluctuations in other stablecoins’ supplies shows a balanced demand for centralized and decentralized coins, each serving different needs and risk appetites within the market.

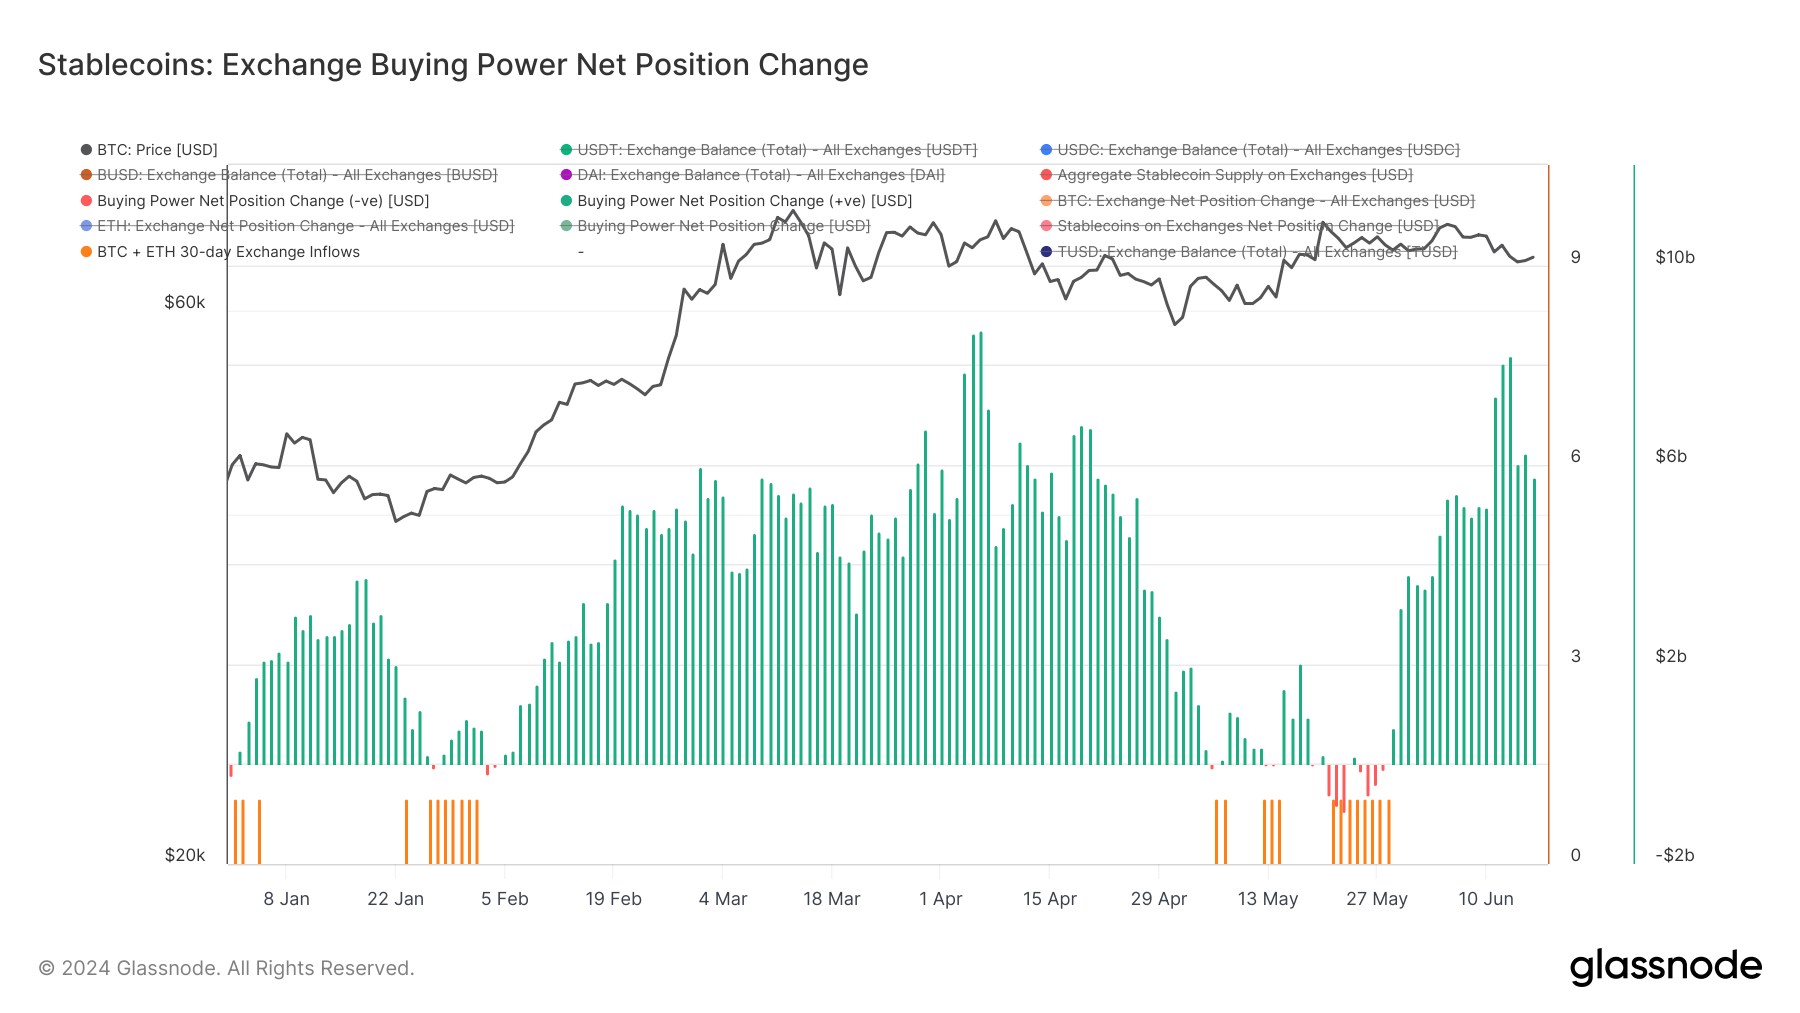
The 30-day change in stablecoin buying power on exchanges, which has increased in the past week without corresponding inflows of BTC and ETH, indicates a significant accumulation of these stablecoins on exchanges.
This accumulation suggests that traders are preparing for potential market moves and hedging against volatility. This behavior indicates the market is in a state of readiness, where participants are prepared to deploy capital swiftly in response to market movements.

Analyzing the Stablecoin Supply Ratio (SSR) alongside changes in the stablecoin circulating supply makes sense because it provides a deeper understanding of how stablecoin liquidity affects Bitcoin’s price.
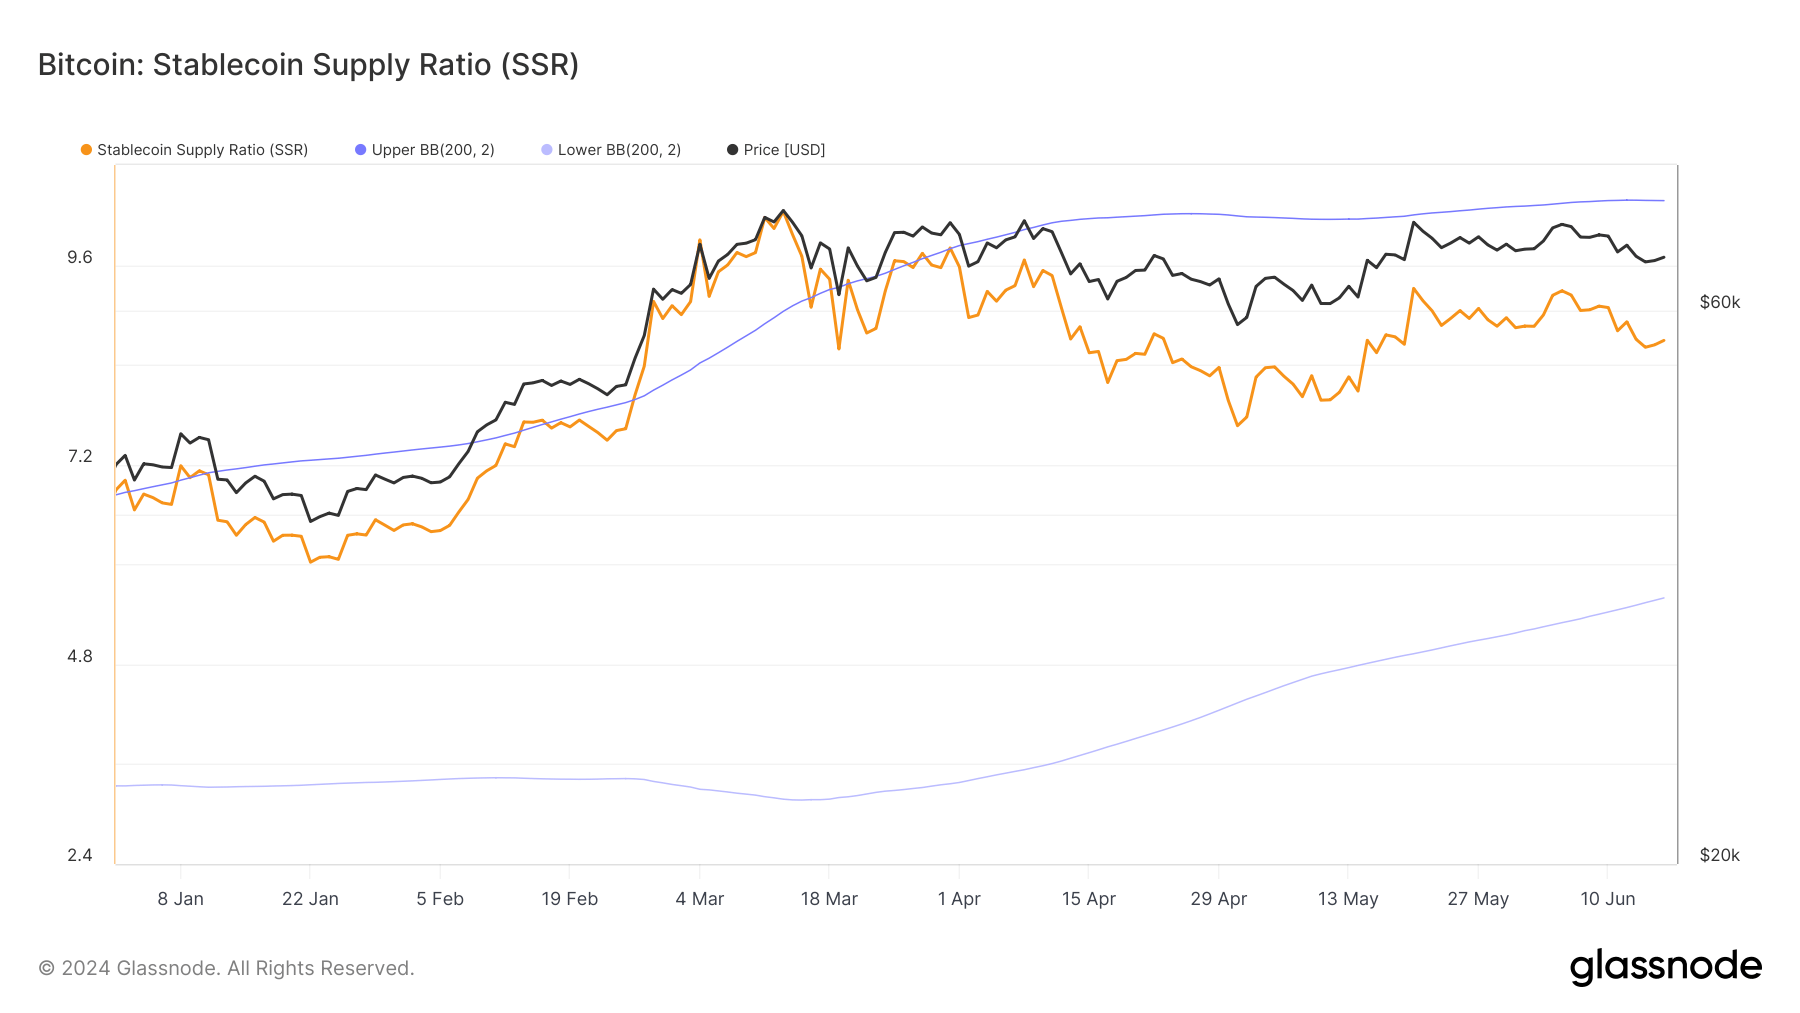
The SSR measures the ratio of Bitcoin’s supply to the aggregate stablecoin supply, highlighting the potential buying power of stablecoins relative to Bitcoin. Significant changes in stablecoin supplies can alter the SSR, indicating potential shifts in market sentiment and the readiness of capital to move into or out of BTC.

The current SSR stands at 8.6919. The SSR’s upper and lower Bollinger Bands, 10.3718 and 5.5973, indicate that it is within a stable range. Historically, Bitcoin peaked when the SSR broke above the upper Bolinger Band, and sharp drops were seen when it fell below the lower band.
This pattern shows that significant movements in the SSR can serve as an indicator for Bitcoin’s price movement, further cementing Bitcoin’s ties to the liquidity coming from the stablecoin market.
Overall, the increasing stablecoin supply, the significant 30-day change in stablecoin buying power on exchanges, and the stable SSR indicate a cautious but prepared market. Investors seem to be positioning themselves for potential volatility, relying on stablecoins as a buffer while closely monitoring Bitcoin’s price movements through the SSR.
This environment suggests a period of consolidation where market participants are waiting for clearer signals before making substantial moves.
The post Demand for stablecoins grows as market prepares for volatility appeared first on CryptoSlate.

